Logs

Open Logs from the gear menu in the top navigation to view log messages related to all app functions.
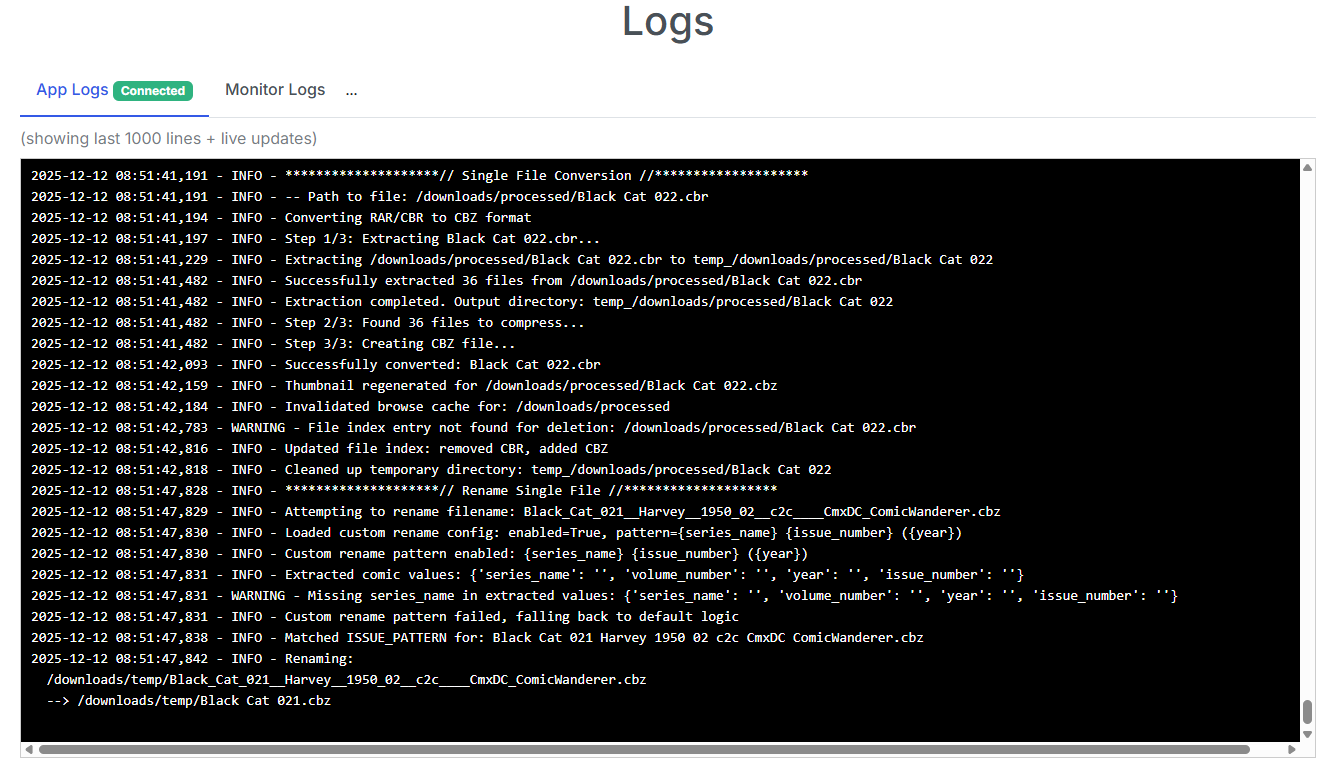
The viewer has two tabs — App Logs and Monitor Logs — each showing the last 1000 lines plus live updates. A status badge on each tab shows Connected while log updates are streaming, or Error if the connection drops. Monitor Logs load the first time you open that tab.
In the example above, we can see a few things:
- App Status: Startup up message and folder-monitoringenabled (yes/no)
- Rename File: Renaming to / from messaging
- Single File Conversion: Details of the file being converted and it's location
- Error Messages: While there are none displayed, error messages will show here as well
Download Debug Package
New in v6.0
The Download Debug Package button is new in v6.0.
At the top of the Logs page, the Download Debug Package button bundles your config, settings, and recent logs into a single download to share when asking for support.
Secrets are redacted
Secrets (API keys, passwords, tokens) are redacted from the debug package before it's built — but always give it a quick look before posting it publicly.
This is the fastest way to give the CLU team what they need when reporting a bug on Discord or GitHub.
(For enabling more verbose logs before you generate a package, see Debug Logging below.)
Log Message Details
Most functions the app performs will have INFO level logging providing details of the processes being performed. These are helpful for debugging and understanding what the app is doing.
Most major app functions will have a start message like this:
2025-12-12 10:26 - INFO - *****************// Single File Conversion //*****************
followed by the details of what is being converted, moved, renamed, etc.
Folder Monitoring Logs
If you are using folder monitoring, you will see log messages related to the files being monitored and downloaded in the "Monitor Logs" tab.
Debug Logging
Debug logging provides more detailed information about the app's internal state and can be helpful for debugging and understanding what the app is doing.
This can be enabled by visiting the System Settings page and enabling the Debug Logging option.
This will show any log messages at the DEBUG level or higher.
2025-12-12 10:29:50,293 - INFO - Debug logging enabled
2025-12-12 10:29:52,664 - DEBUG - 📁 Config file location: /config/config.ini
2025-12-12 10:29:52,666 - DEBUG - ✅ Config file loaded successfully (no migration needed)
2025-12-12 10:29:52,666 - DEBUG - Config file reloaded at:
2025-12-12 10:30:11,349 - DEBUG - 📁 Config file location: /config/config.ini
2025-12-12 10:30:11,350 - DEBUG - ✅ Config file loaded successfully (no migration needed)
2025-12-12 10:30:11,352 - INFO - Debug logging disabled
Console Logging
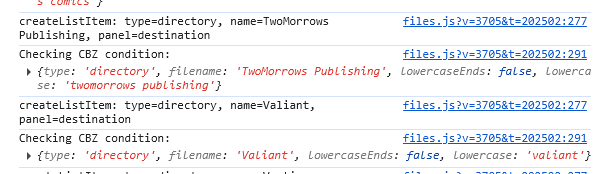
Additional details can be displayed in the console by updating the docker-compose.yaml file. Locate the following line:
- FLASK_ENV=production
and update it to
- FLASK_ENV=development
Most pages will now display additional details in the Dev Tools console log as items load and actions are performed.